This website uses cookies to ensure you get the best experience on our website.
- Table of Contents

At Boster, one common question we get from researchers is, “How do I prepare the ELISA standard?” We’re glad you asked because proper construction of the standard curve is the very first step for every ELISA experiment. The standard curve can help confirm that the quality of the kit and the operation procedures are acceptable for further steps.
For ELISA assays, in order to determine a quantity of something, you need to compare your sample results to a set of standards with known quantities. The standards in your assay should be tested at a range of concentrations that yields data from essentially undetectable to maximum signal. This set of results for the standards allows you to “fit” a statistical model and generate a predicted standard curve. You can think of the standard curve as the ideal data for your assay. Once the standard curve is generated, it is relatively easy to see where on the curve your sample lies and interpolate a value.
So how do you prepare this standard curve? The standard curve is prepared through serial dilutions of the standard analyte with known concentrations that should span the standard curve range. This range is expected to be close to the target protein concentrations in the unknown samples. Here is an example of a serial dilution series from a stock solution to generate a standard curve of 3.9 –2000 pg/ml:

Here are some guidelines for making proper dilutions:
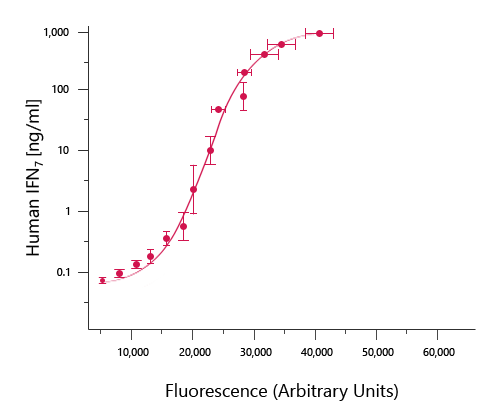
Once the intensity of each well has been measured on the ELISA plate reader, you can calculate the average absorbance values for each duplicate/triplicate sample. Then generate a standard curve by graphing the mean absorbance for each sample (x-axis) vs. the standard concentration (y-axis). Typically, a standard curve will have a sigmoidal shape in which the higher concentrations of standard dilutions will reach a plateau in absorbance.

In the example graph above, it is the relatively long linear region of the curve that makes the ELISA results accurate and reproducible. Find the portion of the curve that is linear and draw the best-fit trendline for the data. Many ELISA plate readers have built-in programs for generating and analyzing standard curves. Alternatively, you can use Microsoft Excel, or other graphing software to generate the equation of the line (i.e. y=mx + b; m= slope of the line and b= y intercept) and the R2 value. The R2 value is an indication of how closely the data fit the trendline. An R2 value of 1 would be perfect. Use the equation to calculate the concentration of each sample by using the average of the duplicate/triplicate samples for x in the equation. If the concentration of the sample exceeds the highest point of the curve or does not lie within the linear range of the curve, then dilute the sample prior to measurement. If a diluted sample is used, remember to multiply by the dilution factor to obtain the final value.
It is important to understand that a standard curve run at different times will not have the same OD values for each dilution. This is due to operator differences and slight differences in pipetting, incubation times and temperature. So in order to yield reliable data, a new standard curve should be prepared for every experiment and for every new plate along with your unknown samples.
Sometimes after your standard curve is generated, things still don’t seem right. If you’re thinking, “The results of my standards do not look correct. What could be the problem?” Let us offer some advice. Typically, we recommend double checking your protocol for the plate washing step. It should be examined from three aspects:
The washing steps are necessary to reduce background signal related to unbound, conjugated antibody and thereby increase the assay’s signal-to-noise ratio. Washing between steps ensures that only specific (high-affinity) binding events are maintained for generating signal at the final step. Insufficient washing can result in variation and high background, and thus poor results. Remember to always follow the protocols provided by the manufacturer. Boster provides ELISA protocols both online and on our PicoKine ELISA kit’s datasheets.
If you have any further questions, don’t hesitate to contact [email protected] for more information.